Welcome to the first chapter. Before starting to learn how to use this powerful system, we need first discuss the details about all the elements, like how to get installation files and serial number, what are the hardware and software requirements and the most important thing - where to implement this system in order to capture packets in your network.
Get Installation Files and Serial Number
First, let's start with how to get the installation files and the serial numbers that we use to activate the nChronos Server and Console. Let's see how different users get their installation and serial number.
- Commercial Customers: you'll receive an email containing software download links (including server and console software) and also serial number that you'll use to activate the server after your purchasing.
- Evaluation Users: if you want to evaluate the Standard edition before purchasing a commercial edition, you can apply for an evaluation. Fill out the application form to apply for an evaluation and the download link and serial numbers will be sent to your email address in a confirmation email.
Didn't receive a confirmation email?
For evaluation users, if you did not receive the confirmation email:
- Please try again with the application form.
- Please try with a different email address.
- Please report to our support by emailing .
Prepare Server & Console Machines
Now, the installation files and serial numbers are ready. Let's see what hardware and operate system we need. First, we will talk about hardware. Colasoft nChronos is made up by two parts: the nChronos Server and the nChronos Console. Colasoft nChronos is able to handle the throughput capacity up to 40 Gbps. So in a heavy-loaded network environment, a high-performance server machine, and mass storage hard drivers (Raid) are recommended. At least two machines are required, one to install nChronos Server and another for nChronos Console. Read the pages below to learn the System Requirements.
Can I install nChronos Server and Console programs on the same machine?
I’m sorry that you are not able to do so. Colasoft nChronos Server works on the Linux environment, while nChronos Console works on the Windows environment.
Decide Where to Capture Packets
Let's have some basics on packet analysis tech. To be brief, Colasoft nChronos captures packets from a network interface card (those packets come from the connected cable) and analyzes them to show you what the machines are transmitting. All these works are done without the notice of the monitored hosts in your network. So capturing all packets is the first step to understand your network communication pattern and of course you need to capture on the right device, because you can't just install nChronos Server on a system like other software and then capture packets from other machines.
Please move on to – Capture Environment Setup – which illustrates several network settings to show you which networking device you should nChronos Server connected to, so you get all packets to and from the Internet. If you have different types of network setting please contact our support for guidance or leave a comment below.
In the last tutorial we have learned:- How to get the Serial Number
- What are the system requirements for Colasoft nChronos
- On which device should we connect nChronos Server to capture packets on the network
Before heading into this lesson, please make sure you fully understand these questions. If not, you are recommended to go back to take a look at last lesson again, or you can email us for help with your specific need.
Install nChronos Server
We are glad to see that you've finally come to the decision to implement nChronos on your network. As you know nChronos consists of two components - nChronos Server and nChronos Console, and please make sure that your server machine meet the system requirements before the installation. You could follow the guidance to install the CentOS. After installation the CentOS, please follow the steps in nChronos Installation Manual.
Activate nChronos Server
To activate your nChronos Server, you could follow the guidance at: https://www.colasoft.com/nchronos/activation.php
Install nChronos Console
Colasoft nChronos Console is a stand-alone component for connecting to nChronos Server to display data.
Before installing nChronos Console, you should:- Make sure your machine meets the minimum system requirements.
- Close all running applications on your machine.
- Uninstall any earlier or trial version of nChronos Console.
- Double-click the installation file of nChronos Console, and then the Setup wizard appears. Click Next.
- On the License Agreement page, review the License Agreement and, if you agree, select the I accept the agreement check box, and then click Next.
- Review the product updates, and then click Next.
- Specify an installation directory. By default, the installation directory is C:\\Program Files\\Colasoft CSRAS Console 6.x. To specify another directory, use the field provided or click Browse to locate an installation folder. Then click Next.
- Specify the folder name on the Start, and then click Next.
- Specify whether to create a desktop icon and a quick start icon, and then click Next.
- On the Ready to Install page, review the installation information and, if all information are correct, click Install to install nChronos Console to the computer.
- Review the Readme, and then click Next.
- Click Finish to complete the installation. By default, the Launch Program check box is selected to launch the program after the installation.
Activate nChronos Console
nChronos Console does not need to be activated since version 6.2.
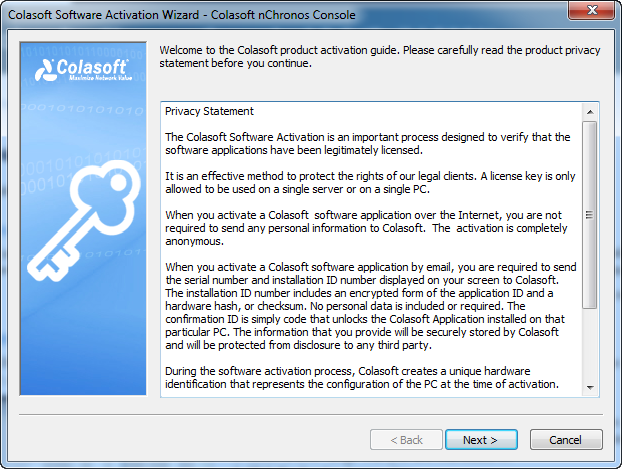
For old version, after the installation, the Activation Wizard appears to guide you step by step through the activation process.
In the last tutorial we have learned:
- What are the components of Colasoft nChronos
- How and where to install nChronos Server and Console software
- How to login and activate nChronos Server
Before heading into this lesson, please make sure you fully understand these questions. If not, you are recommended to go back to take a look at last lesson again, or you can email us for help with your specific need.
In this lesson we will learn how to start a link analysis. First, we should take a look at this term - Network Link. A network link is defined as a logical link which collects and analyzes packets from one or multiple network interface cards. We can simply consider the network link as a Project. Now let's see how to start a link analysis. Before starting a link analysis, we need to make some link configurations.
Log to Server from a browser
- You can log into nChronos Server from the browser. To log into a Server from a browser, follow the steps below:
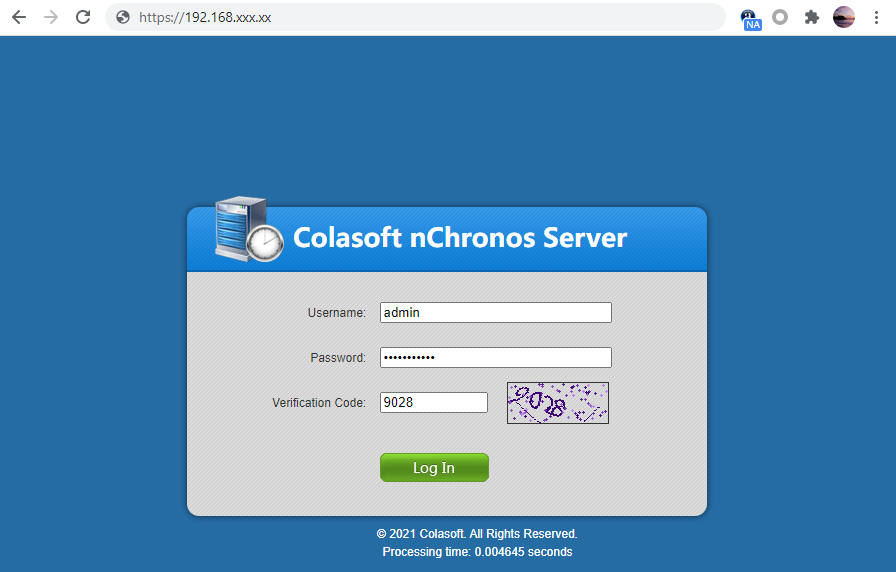
- Launch a browser, in the address bar input https://xxx.xxx.xxx.xxx (xxx.xxx.xxx.xxx stands for the IP address of the nChronos server) and then press ENTER. The IP is the IP address of the management interface of nChronos Server. On nChronos Server login portal, input the user name admin and the password D&^4Vs!(, and then press ENTER.
- Click Log In to log in the Server.
Configure Storage Settings
You should further configure the storage space to store data.
- To allocate the storage space,
- Login the Server from a browser.
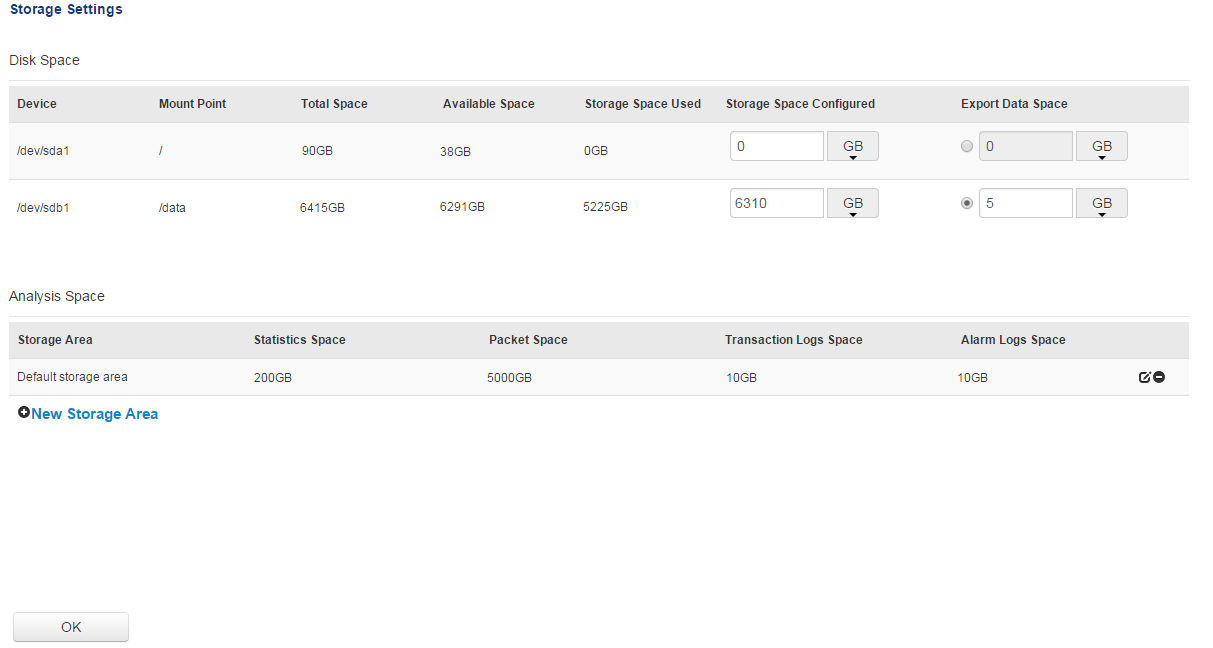
- Click Storage Settings on the left navigation bar to get into the Storage Settings page:
- Enter an integer for the Storage Space Configured box to set the space for storing nChronos Data.
- Click New Storage Area to create a storage area
- Click OK to save settings.
Configure Interface
The nChronos Server requires at least two network interfaces on the server machine, one works as the Management interface and the others work as Capture interface. The Capture interfaces are for capturing traffic and delivering it to nChronos Server, while the Management interface is for nChronos Console communicating with nChronos Server.
- To specify the capture interface and the management interface,
- Login the Server from a browser.
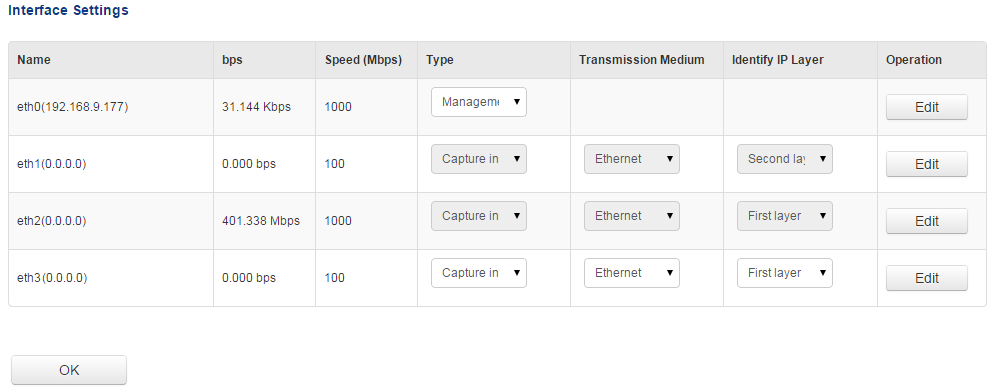
- Click Interface Settings on the left navigation bar to get into the Interface Settings page, which lists all available adapters:
- Under the Type column, select an appropriate interface type for the adapters.
- Click OK to save the settings.
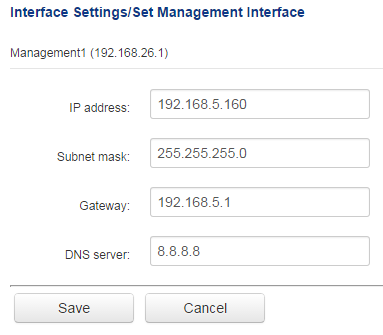
After specifying the Capture interface and the Management interface, if you need to modify the settings of the Management interface, follow the steps below:
- Click Edit following the Management interface to get into the setup page, like the following figure:
- Enter the IP address, subnet mask, gateway, and DNS server address, and then click Save.
- If you need to set up a virtual capture interface, just click the Edit button following the capture interface to go to the Virtual Interface page, and then set up a virtual interface.
Add a Network link
- To add a network link, follow the steps below:
- Login the Server from a browser.
- Click Link Configuration on the left navigation bar to get into the Link Configuration page
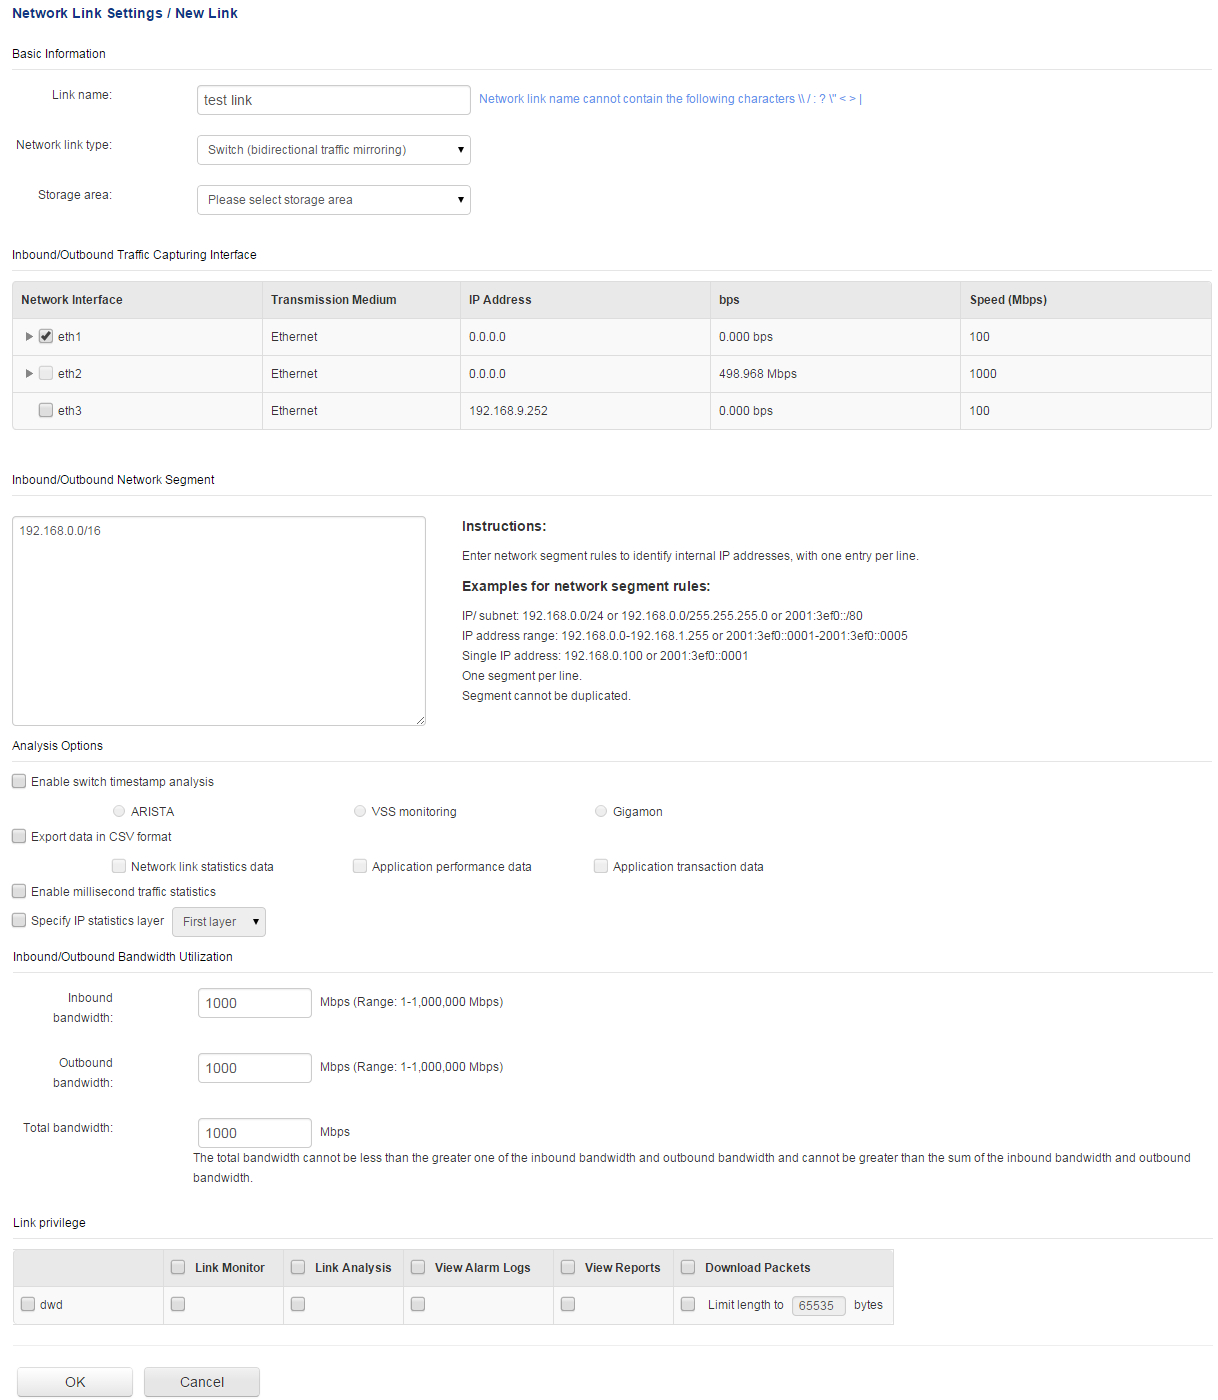
- Click New Link to show the following page:
- Enter the link name and select a link type. The following list describes the link types.
- Switch (mirrored bidirectional traffic): nChronos captures traffic from the switch which has mirrored traffic, including inbound and outbound.
- Switch (mirrored unidirectional traffic): nChronos captures traffic from the switch which has mirrored one-way traffic, inbound or outbound.
- Standard tap: A network tap which only mirrors one-way traffic, inbound or outbound.
- Aggregation tap: A network tap which mirrors bidirectional traffic, including inbound and outbound.
- Select a storage area for the network link. The data of multiple network links can be stored on one storage area.
- Set capture interface and network segments: If you select Switch (mirrored bidirectional traffic) or Aggregation tap, follow the steps below:
- Select the capture interfaces which are connected with the mirror port of the switch or the tap.
- Set the network segment, which is for identifying the transmission direction of the packets to further get accurate inbound and outbound traffic statistics. You should enter the IP addresses and the segments that should be recognized as internal addresses.
- Select the capture interfaces that are connected with the outbound mirror port of the switch or the tap for capturing outbound traffic.
- Select the capture interfaces that are connected with the inbound mirror port of the switch or the tap for capturing inbound traffic.
- Set up whether to use switch timestamp, whether to export data, whether to enable millisecond analysis.
- Set bandwidth. Enter the inbound bandwidth, outbound bandwidth, and the total bandwidth. You should type the actual bandwidth to get accurate bandwidth utilization.
- Click OK to complete the network link.
Run a Network Link
To monitor real-time network data from the Console side, get the analysis statistics of the network traffic, or download packets from the Server, you must first run the link.
To run a network link, just click the button Run on the Link Configuration page.
In the last tutorial we have learned:Before heading into this lesson, please make sure you fully understand these questions. If not, you are recommended to go back to take a look at last lesson again, or you can email us for help with your specific need.
From this lesson on we will move to the nChronos Console. The nChronos Console is a software component that we use to monitor and analyze the network performance. The nChronos Console is able to interactive with the server, such as retrieving analysis, download packets from the server, etc.
Colasoft nChronos Server Network Connection Setup
We can install nChronos Server on a virtual machine if we just want to know how it works. But that is not how it is designed, and this will limit its performance. We would highly recommend you to install the nChronos Server on a real server machine. Also after the deployment, please make sure that they are able to communicate with each other.
- Both the server and console machines can communicate on the network. Note that if you use nChronos server to capture packets from a switch's mirror port, your server might not be able to communicate on the network. If that's the case you need to add an additional network card and connect it to a normal port of the switch to communicate with nChronos console.
- The firewall on the server needs add the TCP port number that the console can use to connect to the server. The default port number is TCP #3000. Please follow the guidance to add the port to the server.
Then we can use nChronos console to start our first connection with nChronos server. Run nChronos Console and follow the instructions bellow to establish a connection with the server.
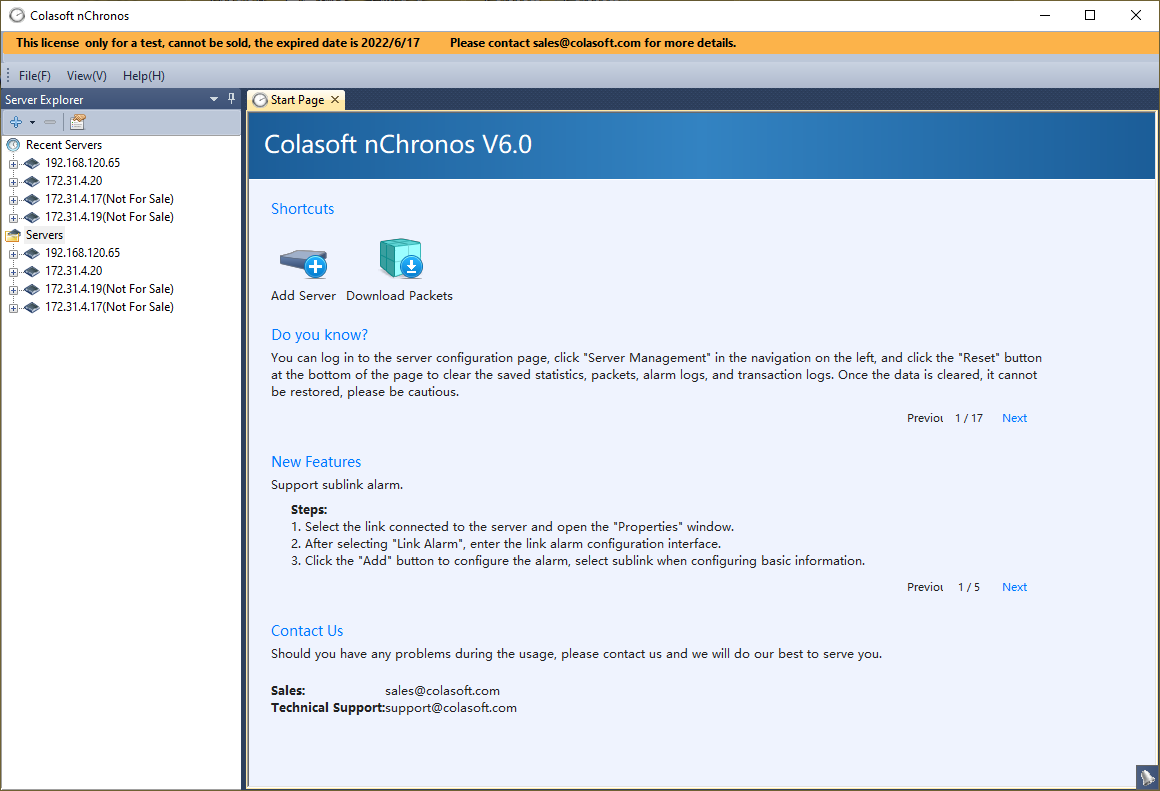
- Double-click nChronos Console icon on the desktop, to start nChronos Console, click Start > All Programs > Colasoft nChronos Console V6.0 > Colasoft nChronos Console V6.0 (x64).
- On the Server Explorer, click Servers, then click
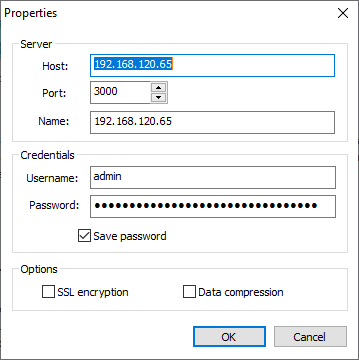
 and click Add Server; the Add Server dialog box appears.
 - Enter the IP address of nChronos Server and type the username and password.
- Click OK after completing the Add Server dialog box. Then the added Server will display on the Server Explorer.
- To connect to nChronos Server, right-click the server name and click Connect.
Cannot connect to nChronos server from nChronos console?
If we have followed nChronos Server Network Connection Setup to make sure the server is connected to the network we should be able to connect to the server successfully. But if it turns out to be any error while trying to connect to the server, we can do the following step to troubleshoot the connectivity.
- Make sure that you are using the right username and password.
- On your console machine, please check if you can get response when ping to nChronos Server. If not, please make sure that both your console machine and your server machine are connected to the network.
- If you can get response from the ping, please check if your nChronos service is still running on the server side with command: service csrass status
- If the nChronos service is not running, please start the service with command: service csrass start
- If the nChronos service is running, please check if you enable the port number 3000 of the firewall on the server. If not, please follow the guidance to enable the port.
- How to connect to a nChronos server from Console
- How to troubleshoot connection error issues
Before heading into this lesson, please make sure you fully understand these questions. If not, you are recommended to go back to take a look at last lesson again, or you can email us for help with your specific need. The biggest advantage of this retrospective network analysis product is that we can either have a long term or short term view on our network running status, and we can choose to look into a specific period of time.
By default, the trend chart shows traffic stats of past 1 second and we can see the traffic utilization, packet count, and traffic volume of each second. If we change the window size to 1-day, each scale on the trend chart represents a day, and the statistics are the sum of each day. The bigger the window size value, the more resources are required on the server to retrieve and analyze the statistic data.
Time Window
The following list describes the icon buttons on the Time Window.
 : These icon buttons are for setting the time range of the Time Window.
 : Click corresponding time scale to select a time window type.
 : Click this icon to select a data type to display.
You can drag the Time Window to view network data of past time range. To drag the Time Window, move your mouse on the time scales of the charts, and drag when the mouse becomes .
.
You can choose to set the Time Window or to set the selected time range.
- Click
 and select Set Time Window. The Set Time Window dialog box appears.
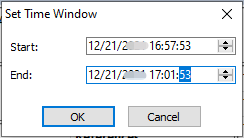
- Set the start time in the Start field and set the end time in the End field.
- Click OK.
Select a Time Range
The analysis views below the Time Window display the data of selected time range on the Time Window.
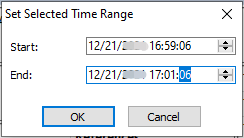
You can drag the handles to widen or narrow the time range.
In the last tutorial we have learned:- The user interface and components of the stat view
- How to select time range
In this lesson we will take a look at the user interface of nChronos Console. The nChronos Console is the component that we use to monitor the real time network performance, view network analysis stats, perform drill-down analysis, etc. When we start the nChronos Console, the Start Page will show up. One the Start Page, we can find the latest official news, product tips, and the contact information. If we add a server connection (more details on last lesson) on the Server Explorer (left-side panel), we can connect to the server, and it opens the stats view. The view contains a trend chart and several stats views.
The Trend Chart
With the trend charts, we are able to have a graphical view of traffic trends. It helps us identify when the traffic drops and when climbs more visually than just numbers, and then we can focus on the abnormal time period to see what happened during that period closely. So it is often the starting point where we start out retrospective and drill-down analysis. By default, the time window shows the traffic trend of past four minutes. When we change or move the time window, the chart refreshes automatically. We can zoom in to time unit of second and zoom out to day, which means if we have a 4-minute time window we can view traffic stats of every second, while 7-month window shows stats of each day.
If we are interested in looking into a specific time period, we can click and drag to select a time span on the trend chart to view traffic statistics of that period. By selecting a time span on the trend chart, the views down below displays only the statistics of that time period, it helps us focus on only that small slice of time. For example, we are reported that users cannot access the webserver at about 7:00 AM to 7:15 AM, and we need to figure out the causes of this downtime. Now we can connect to nChronos server, and rewind back to the time window of that period, select time period between 7:00 - 7:15 AM. And the views will refresh to show the traffic statistics during those 15 minutes. Then we can use the drill-down feature to focus on analyzing the webserver address, and check the data link layer, Internet layer, and its TCP transports.
Statistic Views
There are several views below the trend chart which display types of statistics in different tabs. They work together with trend charts and time span selection to reduce statistic data volumes and let us focus on analyzing and drill-down to look into network issues. The views are described below:
There are several analysis views to display the statistics in different types. They work together with trend charts and time range selection on it to reduce statistic data volumes and let you focus on analyzing and drilldown to look into network issues.
Icon Buttons on the toolbars of the views
- There is a toolbar on the top of each analysis view and the same buttons on different toolbars have the same functions.
- The following list describes some buttons on the toolbar.
 : Downloads packets of current time range. For more information about downloading packet, see Download Packets dialog box in this section.
 : Launches the Expert Analyzer to analyze the packets of selected time range.
 : Saves the current statistical list as a .csv file. For more information about exporting statistics, see Export Statistics dialog box in this section.
 : Click to generate a temporary report based on the statistics on the current view.: Click to generate a graph based on the statistics on the current view. Click the icon again to close the graph back to list data.
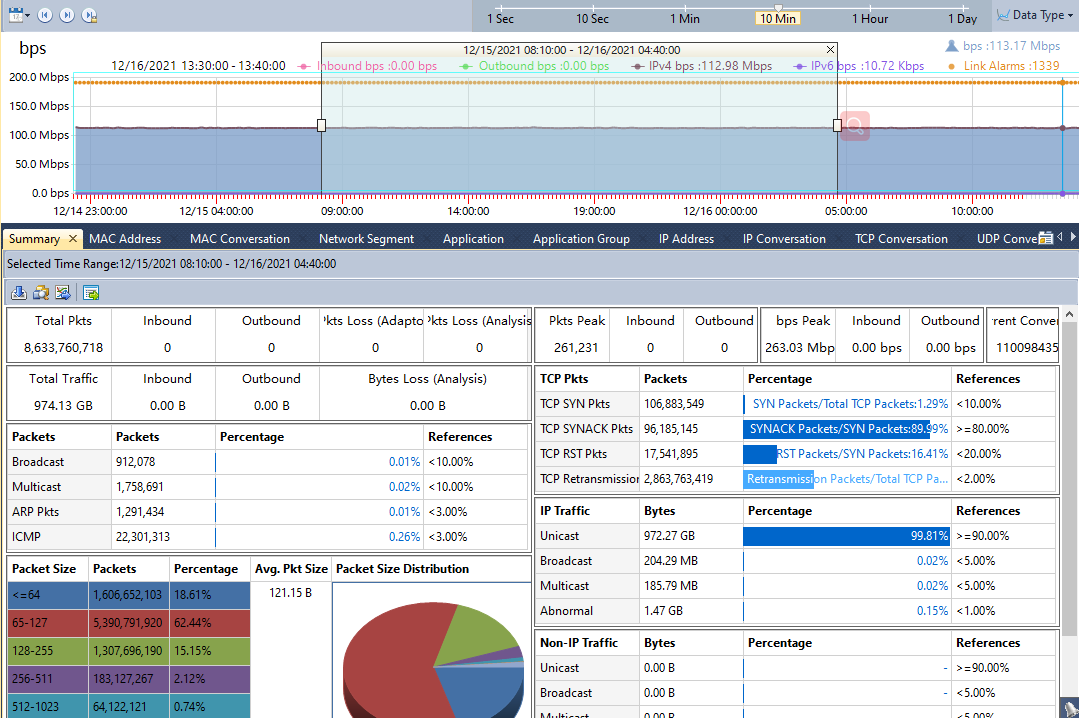
The Summary view
The Summary view provides overall summary statistics of alarms, utilization, traffic, packets and TCP packets of selected time range on the trend chart.
The MAC Address view
The Physical Address view displays the traffic of the network according to MAC addresses, as well as bytes, and packets. Right-click the column header and click the appropriate column, then you can view the statistics in the form of other statistical fields.
The MAC Conversation view
The Physical Conversation view displays the traffic of the network according to physical communication nodes, as well as node bytes, and packets.
The Network Segment view
The Network Segment view provides the statistics and analysis of the traffic according to network segments which are defined when configuring the network link.
The Network Segment Group view
The Network Segment Group view displays the statistics of network segment groups which are defined when configuring the network link.
The Application view
The Application view provides statistics of network applications, including system applications and custom applications. The system applications are uploaded to the library when configuring the Server at the Server side and the custom applications can be customized when configuring network link at the Console side. The custom applications have priority over the system applications.
The Application view displays the traffic of the network according to applications name, as well as bytes, packets, and average packet size. Right-click the column header and click the appropriate column, then you can view the statistics in the form of other statistical fields.
The Application Group view
The Application Group view displays network traffic statistics based on application groups which are defined when configuring the network link.
The IP Address view
The IP Address view provides the statistics and analysis of the traffic according to IP addresses. By default, this view displays the statistics of internal IP. You can click External IP to view the statistics of external network.
The IP Address view displays the traffic of the network according to IP addresses, as well as bytes, packets, and average packet size. Right-click the column header and click the appropriate column, then you can view the statistics in the form of other statistical fields.
The IP Conversation view
The TCP Conversation view displays the traffic of the network according to communication nodes, as well as node geographic location, port number, application, round-trip time, bytes, packets, and average packet size.
The UDP Conversation view
The UDP Conversation view displays the traffic of the network according to communication nodes, as well as node geographic location, port number, application, bytes, packets, and average packet size.
The Segment-Segment view
The Segment-Segment view provides the statistics and analysis of the traffic according to network segments which are defined when configuring the network link.
The Service Access view
The Service Access view displays application access statistics of the monitored network link, including server/client IP, service port number, application, traffic, and TCP packets.
The Port view
The Port view includes two tabs: TCP Service Port and UDP Service Port, displaying port access statistics based on IP address + port number.
The Service Port view
The Service Port view displays port access statistics based on IP address + port number. Right-click the column header and click the appropriate column, then you can view the statistics in the form of other statistical fields.
The Link Alarms view
The Link Alarms view displays the link alarm logs according to alarm types which include traffic alarm, email alarm, domain alarm, and signature alarm. All link alarm logs are listed with trigger time, alarm category, alarm name, severity, and trigger condition, etc.
The Virtual Network view
The Virtual Network view displays virtual network statistics based on ID. Right-click the column header and click the appropriate column, then you can view the statistics in the form of other statistical fields.
The DSCP view
The DSCP view displays network traffic statistics based on DSCP markings.
The views above mentioned, except the Summary view, will have records displayed only when you select a time span on the trend chart. And when you change the selection of the time span, the statistics on the views will refresh automatically. And you can select records in the views and right-click to select drill-down analysis, by this way, you are able to focus on specific network objects and find the source of what you want.
So far, we can see that nChronos console user interface is clear and simple to understand and we are going to talk about how to use the console program in next lesson.
In the last tutorial we have learned:In this lesson we'll see how to download the packets (remember that all packets are saved on the server) to a local file. And then we can use the network analysis tools, like Capsa, to look into the packets.
Before we jump into this chapter, we need to understand that the packets are on the nChronos Server and we are just using nChronos Console to view the traffic analysis stats on our laptop. This means the Server and Console talk through network. Knowing that the Server has been capturing packets from the network for a long time and there might be hundred gigabytes of packets stored on the Server, it is definitely not a good idea to download all of the packets to our laptop through the network. Also this might be devastating to the Server because it takes a lot of CPU usage to process this job and it will affect the analysis performance. We need to notice that when we are downloading packets, the server is still capturing, analyzing and storing the packets.
Well, don't worry. We could still download packets from the Server. We just need to download the packets we need. We could always use the drill-down feature to narrow down the time range, IP addresses counts and packet counts that we need for deeper analysis. For example, we need to check all packets that related with the email server only between 23:00 – 23:15 PM yesterday. So here we know we should first select the time range, from 23:00 – 23:15 PM, last night. And then we can go to the IP Address view, and find the email server's IP. Then we check the checkbox of this IP, right-click on it and we have three options on the menu: Download Packets, Analyze Packets, and Decode Packets.
Decode Packets
Decode Packets allows you to quickly lunch Expert Analyzer to decode packets of selected records. This feature will provide you more details about the packets from certain IPs, conversations, or applications that you want to look deeper into.
To use this feature, please select the records that you want to check for details. Then you can right click on the selected records and click Decode Packets. Or, you could click the button on the tool bar to quickly launch Expert Analyzer to decode packets of all the records under the selected objects.
Analyze Packets
By using Analyze Packets, nChronos Console will launch the Expert Analyzer to analyze the packets of selected records. Analyze Packets is kind of similar to Decode Packets. Although it takes a longer time to launch the Expert Analyzer than Decode Packets does, it allows you to do more with it. The Analyze Packets button will launch the whole Expert Analyzer, which you could set capture filter to focus on the IPs or the protocols you care. You could also view the log in the Expert Analyzer. Analyze Packets is kind of like using Capsa to do the packets replay.
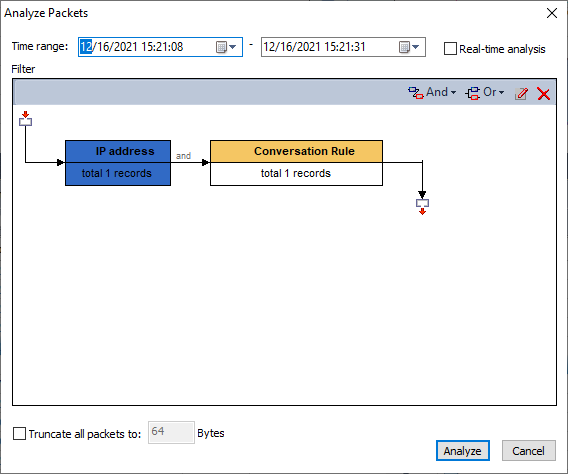
- Click
 on the toolbar of the analysis views to open the Analyze Packets dialog box, which shows as the following figure:
 - Time range: Shows the packets of which time period will be analyzed. You can set the range by typing directly or by pressing the appropriate arrow keys. By default, if a range is selected on the Time Window, the range will be the selected range; and if no range is selected on the Time Window, the range will be just the same as that of the Time Window.
- Real-time analysis: When this option is enabled, nChronos starts to analyze packets from the latest moment until the analysis project is stopped manually.
- Filter: Shows the filters to separate particular packets. You can click And/Or to define filter conditions.
- Truncate all packets to: When this option is enabled, all packets will be truncated to the specified size.
- Complete the Analyze Packets dialog box, and then click Analyze to open the Expert Analyzer user interface.
For more information about Expert Analyzer, you can press F1 when loading Expert Analyzer to get the Help document about Expert Analyzer
Download Packets
By using Download Packets, you could download packets of the selected records from the server. Then you can use the network analysis tools, like Capsa, to look into the packets. Download Packets is different with Analysis Packets. Download Packets will download the packets from the server and save it on your hard disk, while Analysis Packets download the packets from the server to the RAM for analysis. Also, Analysis Packets will automatically open up the Expert Analyzer to analyze the packets you select, but Download Packets only downloads packets, and you need to us the network analyzer, like Capsa, to replay it for the analysis.
- Click
 on the toolbar to open the Download Packet dialog box which shows as the following figure:
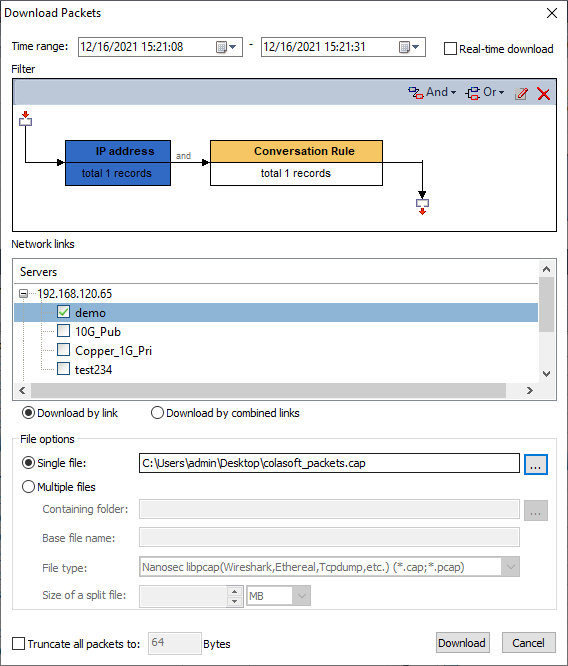
- Complete the dialog box and click Download.
The Download Packets dialog box
- Time range: This option is for specifying the packets of which time range will be downloaded. You can just click the numbers to specify the time or click the little triangle to specify the time. By default, the time range is just the one that you select on the Time Window.
- Real-time download: When this option is enabled, nChronos starts to download packets from the latest moment until the download is stopped manually.
- Filter: This option is for filtering out unnecessary packets. You can set the filter according to application, conversation, address, port, and network segment with logical AND rule and logical OR rule.
- Download by link: When this option is enabled, the packets will be downloaded separately according to network links.
- Download combined: When this option is enabled, the packets from multiple network links will be downloaded together.
- Single file: This option is for downloading the packets of selected time range as one file. You can click
 to specify the file path and the file name.
 - Multiple files: This option is for downloading the packets of selected time range as multiple files. Once you select this option, you should set the following options:
- Containing folder: This option is for specifying the folder for storing the multiple packet files.
- Base file name: This option is for specifying the prefix of the packet file name.
- File type: This option is for specifying the packet file format to store the packets. You can store the packets in .rawpkt format and in .cap format.
- Split size: This option is for specifying the file size of downloaded packets. The downloaded packets will be automatically split into multiple files according to the split size.
Truncate all packets to: When this option is enabled, all packets will be truncated to the specified size.