Colasoft UPM
Unified Performance Management
Maximize business network management efficiency. Provide business-centered environment review, real-time performance monitoring, and rapid fault pinpointing for mission-critical systems.
See UPM in Action
Colasoft UPM collects all real-time analysis data from distributed nChronos probes, providing operations staff with a vivid, graphical working status of every node in the business network.
Visualized business running status & logic diagrams
Proactive network analysis strategy based on business systems
Rapid fault detection to reduce MTTD
Why Choose Colasoft UPM?
Transform network data into business intelligence with six core capabilities.
Business Availability Assurance
Ensure 24/7 reliability with visibility into application access relationships, automatic topology generation, and real-time operation quality monitoring.
Business-Oriented Visibility
Comb mixed business traffic into clear logic diagrams. View color-coded health status (Red/Yellow/Green) on dashboards to instantly gauge business health.
Reduced MTTD & MTTR
Quickly pinpoint the source of problems by evaluating the effect of specific applications on business systems, significantly shortening troubleshooting time.
Comprehensive Metrics
Access over 100+ detailed metrics with abundant graph types for deep business and application analysis, ensuring no blind spots in performance.
Visualized Running Status
Gain a vivid, graphical overview of every node in the business network. Track the quality of each business service with intuitive visualizations.
Multi-Segment Correlation
Perform correlated analysis on data across different network points to locate specific nodes causing service degradation or latency.
Full Business Path Visibility
Automatically discover and visualize application access relationships. Identify bottlenecks at a glance with color-coded health indicators.
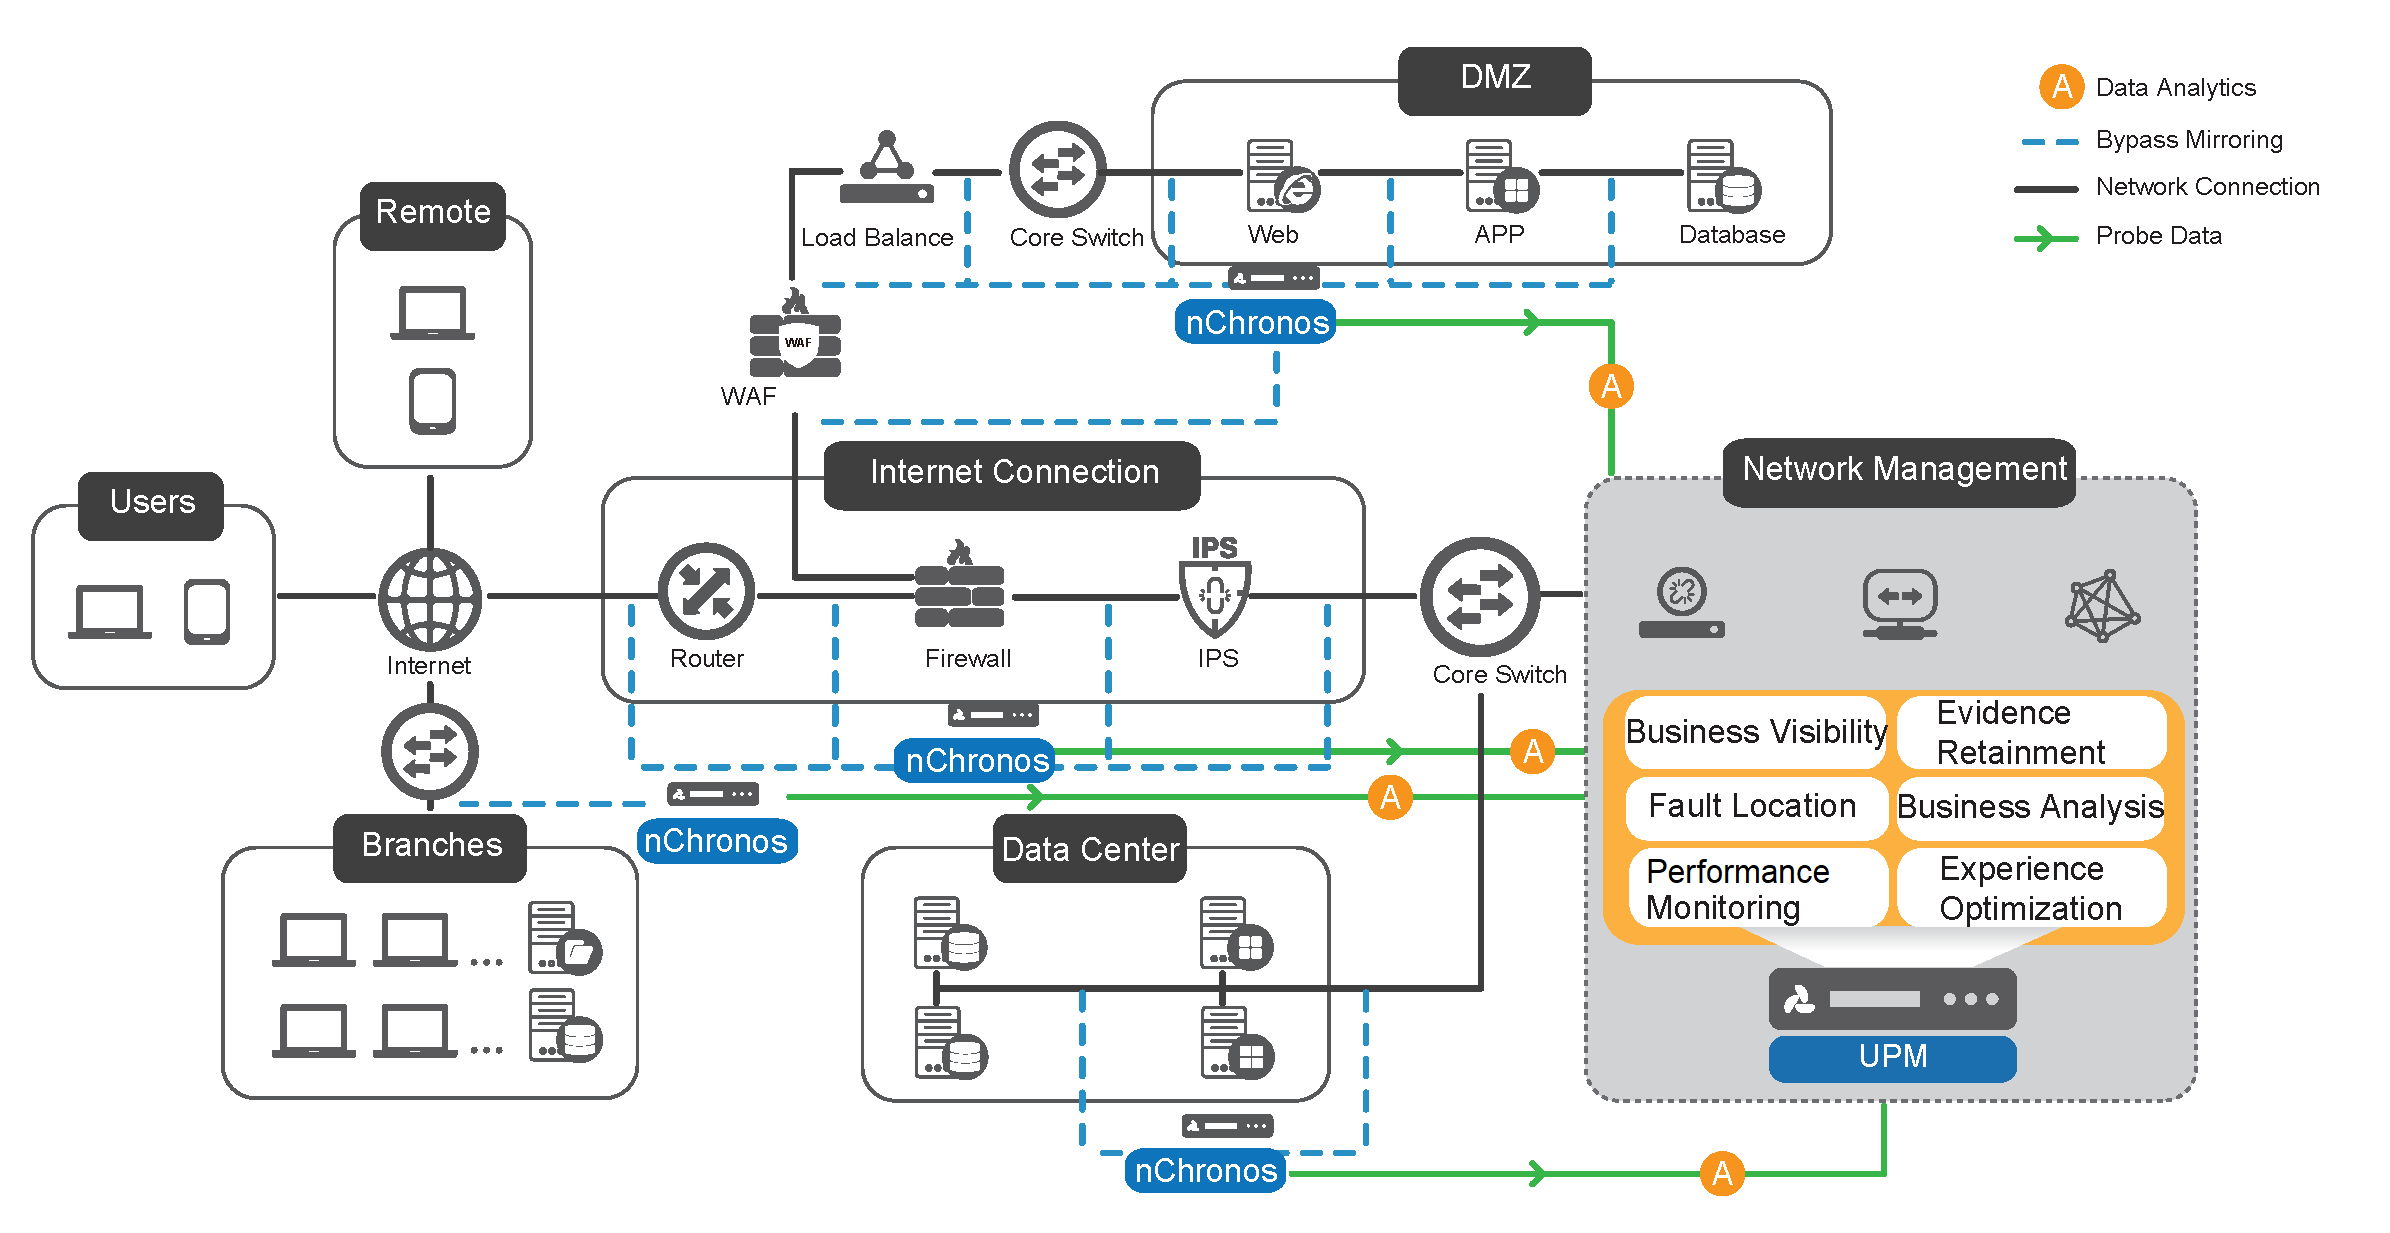
Figure: Business service topology visualization and health monitoring.
Key Functional Capabilities
Comprehensive tools for deep network insight and management.
Full Business Path Visibility
Automatically draws network communication diagrams based on traffic. Visualizes application access relationships and integrates them into a clear business topology.
Multi-Segment Analysis
Supports hop-by-hop analysis to identify network lag. Correlates data from distributed probes to locate the exact segment causing performance drops.
Flexible Custom Monitoring
Allows users to customize metrics, dashboards, and views. Supports creating specific monitoring templates for unique business requirements.
Real-Time Intelligent Alarms
Provides default and custom alarms for businesses, applications, and links. Supports baseline alarms and intelligent anomaly detection.
In-Depth Network Insights
Collects real-time analysis data from distributed nChronos units. Supports millisecond-level traffic analysis for high-precision monitoring.
Online Packet Decoding
Enables users to save, retrieve, and download original packets. Includes a built-in web-based decoder for immediate root-cause analysis.
SLA & Trend Reporting
Generates professional SLA reports based on probes, businesses, or applications to help decision-makers master business status and trends.
Application Discovery
Intelligently discovers and maps application relationships. Supports identifying massive numbers of protocols and analyzing service paths.
Technical Innovations
Distributed Architecture
Decouples data capture from analysis. UPM Central collects metadata from distributed nChronos probes, ensuring scalability across large enterprise networks without bottlenecks.
Millisecond-Level Analysis
Supports micro-burst traffic analysis with millisecond precision (e.g., v6.2+), allowing the detection of transient network issues that standard minute-level polling misses.
Intelligent Baseline (AI)
Integrates AI baseline tools (v6.3+) to automatically learn normal traffic patterns and generate alerts only when behavior seriously deviates from the intelligent baseline.
Retrospective Log Analysis
Powerful big data capabilities for history log analysis, enabling users to query full fields, wildcards, and specific keywords across massive historical datasets.
System Requirements
UPM Center Requirements
- Operating System
- openEuler 22.03, Rocky Linux 8.9, Redhat 8.6, CentOS Linux 7.9
- CPU
- 8-core, 2.0GHz or higher
- RAM
- 64GB ECC/RECC or higher
- Storage
- 2TB minimum, I/O ≥ 450 MB/s (RAID5 recommended)
- Database
- MongoDB 4.0.3
Web Console Requirements
- Browser Support
- Google Chrome 85+, Firefox 79+
- Screen Resolution
- 1920 × 1200 (Recommended), 1280 × 800 (Minimum)
Resources & Learning Center
What's New
Explore the latest features and capabilities in the newest UPM version.
Learn moreRelease History
View the complete changelog and version history of Colasoft UPM.
View historyVideo Tutorials
Watch guided tutorials to master UPM configuration and analysis.
Watch nowDocumentation
Access datasheets, user guides, and white papers.
Read docsReady to optimize your
business performance?
Join the enterprises already using Colasoft UPM to ensure service reliability. Get a personalized demo or a detailed quotation today.
Need immediate assistance? Email us atsales@colasoft.com